What Is QR Code Analytics?
QR code analytics is the collection and visualization of data generated each time someone scans your QR code. This data includes when the scan happened, where in the world, what device was used, and how these metrics trend over your campaign's lifetime.
Analytics only work with Dynamic QR codes — since the scan is routed through a redirect server that logs the event before sending the user to your destination.
The QRCodeGen.pro Analytics Dashboard: Every Metric Explained
Overview Tab
The Overview tab gives you a bird's-eye view across all your QR codes:
📊 Total Scans
Cumulative number of times any of your QR codes have been scanned. Includes repeat scans from the same device.
👥 Unique Scans
Estimated unique devices based on IP + User Agent fingerprinting. Repeat scans from the same device within a 24-hour window are deduplicated.
📈 Scan Trend Chart
Line chart of daily scan volume over your selected date range. Look for spikes that correspond to campaign launches, social posts, or seasonal events.
🌍 Top Countries
Ranked list of countries by scan volume. Useful for multi-market campaigns to see regional performance at a glance.
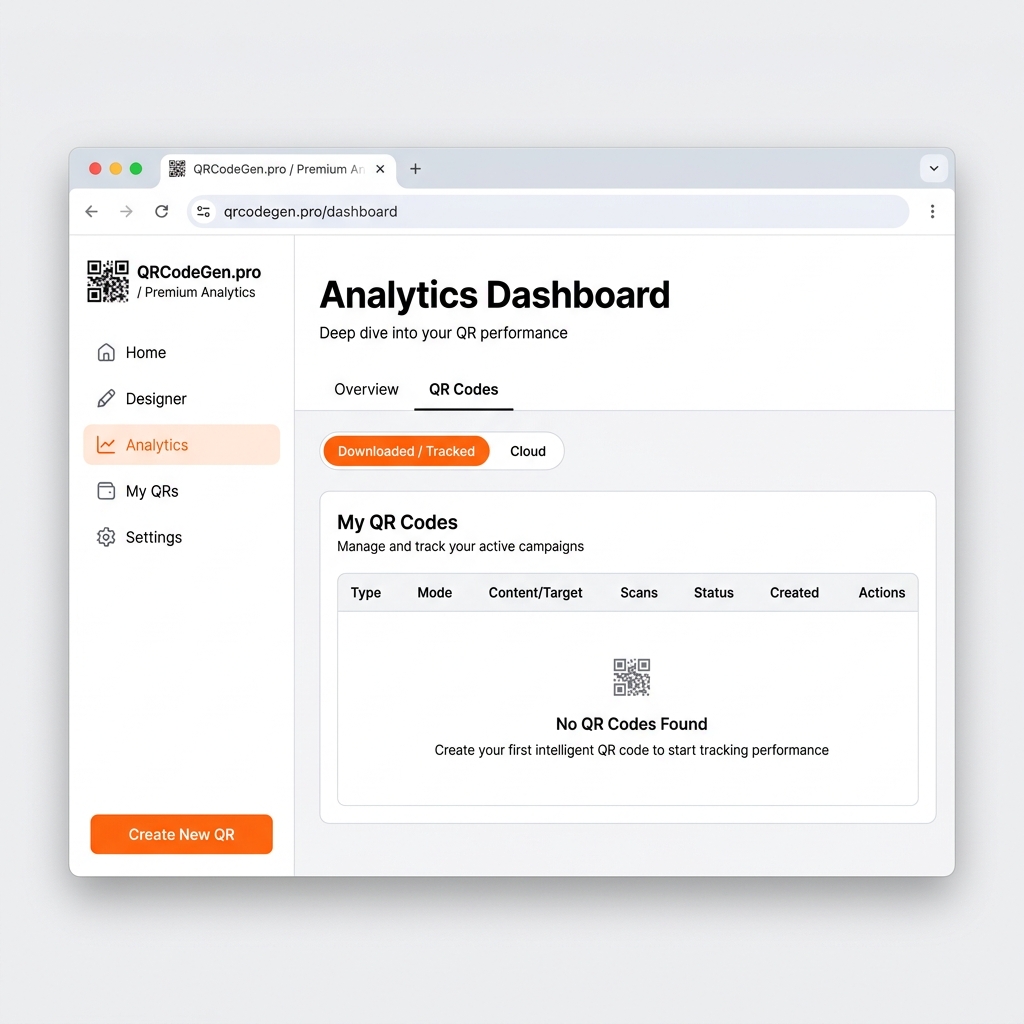
QR Codes Tab
Drill down into individual QR code performance. Each code shows:
- Type — URL, WiFi, vCard, etc.
- Mode — Static or Dynamic
- Content / Target — the encoded destination
- Scans — total scan count for this specific code
- Status — Active, Paused, Expired, or Limit Reached
- Created — creation date for timeline context
Location Analytics: Reading the Map Data
Scan location is determined from the scanner's IP address using geolocation lookup. This provides:
- Country-level accuracy: 99%+ reliable
- City-level accuracy: ~85% reliable for major cities; less accurate in rural areas
How to Use Location Data
For retail and hospitality: Confirm that scans are coming from the expected city or neighborhood. A restaurant in Brooklyn should see almost 100% of scans from Brooklyn/NYC.
For outdoor advertising: If a billboard in Chicago is driving scans from Texas, the destination URL may be appearing in unrelated online contexts — a signal to investigate.
For e-commerce: Unexpected geographic interest (e.g., a US-focused brand getting 20% of scans from the UK) signals untapped markets worth exploring.
Device Analytics: iOS vs Android
Device data tells you the operating system and browser used by each scanner. This matters because:
- iOS users scan directly with the native Camera app — no separate QR app needed
- Android users may use Camera, Google Lens, or third-party QR apps — each with slightly different scan behavior
If 70%+ of scans are from iOS, prioritize your landing page's iPhone experience — test on Safari, check for Safari-specific CSS bugs, and ensure tap targets are large enough for touch interaction.
Peak Time Analysis: When Is Your Audience Scanning?
The hourly heatmap shows which hours of day drive the most scans (segmented by day of week). Common patterns:
- Restaurant menus: Peaks at 12–1 PM and 7–9 PM — lunch and dinner rushes
- Event materials: Sharp spike at event start time, then long tail as latecomers arrive
- Business cards: Peaks mid-morning on weekdays (9–11 AM) — right after networking meetings
- Product packaging: Evenings on weekends — at-home usage / unboxing moments
Using UTM Parameters Alongside QR Analytics
QR code analytics and Google Analytics/GA4 work best together. Add UTM parameters to your destination URL:
utm_source=qrutm_medium=printutm_campaign=summer-menu-2026
This lets you see QR-driven users in your website analytics platform, track their on-site behavior (pages visited, conversions, revenue), and combine it with QRCodeGen.pro's scan data for a full-funnel view from scan to sale.
Reporting: How to Share Analytics With Clients
- Export CSV from your QRCodeGen.pro dashboard (Analytics → Export)
- Import into Google Sheets or Excel
- Build a simple dashboard using Google Data Studio (Looker Studio) — connect your sheet as a data source
- Share a live dashboard link with clients for real-time transparency
Alternatively, take screenshots of your dashboard at campaign milestones and include them in a PDF report with commentary on key insights.
Analytics Red Flags to Watch For
- Sudden spike then flatline: Often indicates the QR code went viral on social media (one-time event), not organic campaign performance
- 100% scans from a single country you didn't target: Your QR code URL may have been indexed and shared in a forum or social platform in that country
- Desktop scans: Usually indicates someone photographed your QR code and uploaded it to a QR scanning website — monitor but don't worry unless it's a large percentage
- Scan count without conversions: People are scanning but your landing page isn't converting — optimize the landing page, not the QR code